
Nairobi’s contemporary spatial landscape—marked by extreme segregation, soaring land prices in specific nodes, chaotic transport networks, informal settlement sprawl, and rapid suburbanization—is not an accident. It is the direct consequence of over a century of spatial master planning, selectively enforced regulations, and long periods of institutional planning voids.
To understand the contemporary real estate market in Nairobi, one must trace the evolution of the city’s major master plans from the colonial era to the present day.
1. The Genesis: The 1927 Feetham Commission & Early Spatial Layouts
Before formalized full-city master plans, the 1927 Feetham Commission Report institutionalized municipal boundaries and governance frameworks for a railway depot that had grown into a colonial headquarters.
Spatial Mechanics
- Racial Zoning: The city was divided into strict racial and socio-economic zones.
- European Enclaves: The green, fertile, elevated western and northern highlands (now Westlands, Lavington, Karen, Runda, Muthaiga) were reserved for European settlers.
- Asian & African Zones: Asian traders were relegated to commercial cores and peri-center areas (Parklands, Ngara, Pangani), while African laborers were restricted to the low-lying, poorly drained east (Pumwani, Kariokor, Kaloleni).
Read Also: Beyond the Headlines: How the Finance Act 2026 Re-Engineers Kenya’s Real Estate Capital Flows
Real Estate Impact Today
- The “Green Line” Value Premium: The western and northern suburbs retained low-density zoning, large plot sizes (typically minimum 0.5 to 1-acre allocations), and proximity to green buffers for decades. Today, these areas command the highest capital land values in East Africa.
- The Eastland Density Trap: High-density, low-service allocations in the east laid the foundation for high-density tenements and lower capital land growth per square meter compared to the West.
2. The Blueprint of Exclusion: The 1948 Master Plan for a Colonial Capital

Commissioned by the Municipal Council of Nairobi and prepared by L.W. Thornton White, L. Silberman, and P.R. Anderson, the 1948 Master Plan was designed for a projected population of 250,000.
1948 Colonial Master Plan
 ├── Western Suburbs (High Elevation) ──► Low-Density / High Value (Lowland/Green)
 ├── Industrial Zone (South-East)      ──► Rail-Served Industrial Corridor
 └── Easternlands (Low Elevation)     ──► High-Density African Labor Quarters
Key Elements
- Neighborhood Unit Concept: Self-contained residential pockets separated by physical buffers, greenbelts, or industrial zones.
- CBD & Industrial Zoning: The Central Business District (CBD) was established as the primary administrative/commercial heart, with industrial development strictly routed to the South-East along the railway line (Industrial Area).
- Controlled Growth: Assumed African populations were temporary urban residents who would eventually return to rural areas.
Real Estate Impact & Implementation Failure
- Failure to Plan for Influx: At independence in 1963, the relaxation of influx control laws caused rapid rural-to-urban migration. Because the 1948 Plan made no provision for high-capacity African housing, informal settlements (Kibra, Mathare, Mukuru) expanded rapidly on unallocated, low-lying riparian land.
- Mono-Centric CBD Bottleneck: By anchoring all major commercial activities in a single CBD, the plan created a radial transport system where all roads converged on a single point, setting the stage for gridlock decades later.
Read Also: The Hidden Yields: Why Slum Landlords Can Outperform Upscale Properties in Nairobi
3. Post-Independence Expansion: The 1973 Nairobi Metropolitan Growth Strategy (NMGS)
Faced with severe urban population pressure, the government—supported by international donors—formulated the 1973 NMGS. It was an ambitious, forward-looking strategy designed to guide Nairobi’s growth up to the year 2000.
Key Strategic Objectives
- Decentralization: Proposed satellite growth nodes (Thika, Athi River, Machakos) to relieve pressure on the core city.
- Bypasses and Transport Corridors: Envisioned arterial bypass roads (Northern, Eastern, Southern Bypasses) to route heavy commercial traffic around the city center.
- Boundary Extension: Expanded Nairobi’s administrative boundaries to 696 km2.
The Breakdown (1980s – 2000s)
The 1973 Plan was largely unimplemented due to political changes, economic downturns in the 1980s, structural adjustment programs (SAPs), and the dissolution of the elected City Council in favor of appointed commissions (1983–1992).
1973–2005 Implementation Void
 ├── Unenforced Zoning Guidelines ──► Illegal Land Subdivisions & Infill Development
 ├── Delayed Bypass Construction   ──► Severe Core CBD Gridlock
 └── Unplanned Land Speculation    ──► Unserviced Ribbon Development along Transit Lines
Real Estate Impact
- Unplanned “Infill” Development: Without municipal enforcement, residential neighborhoods designed for single-family homes (e.g., Kilimani, Kileleshwa, Lavington) saw widespread, illegal conversions into high-rise apartment towers without upgrades to sewer lines, water supply, or electrical grids.
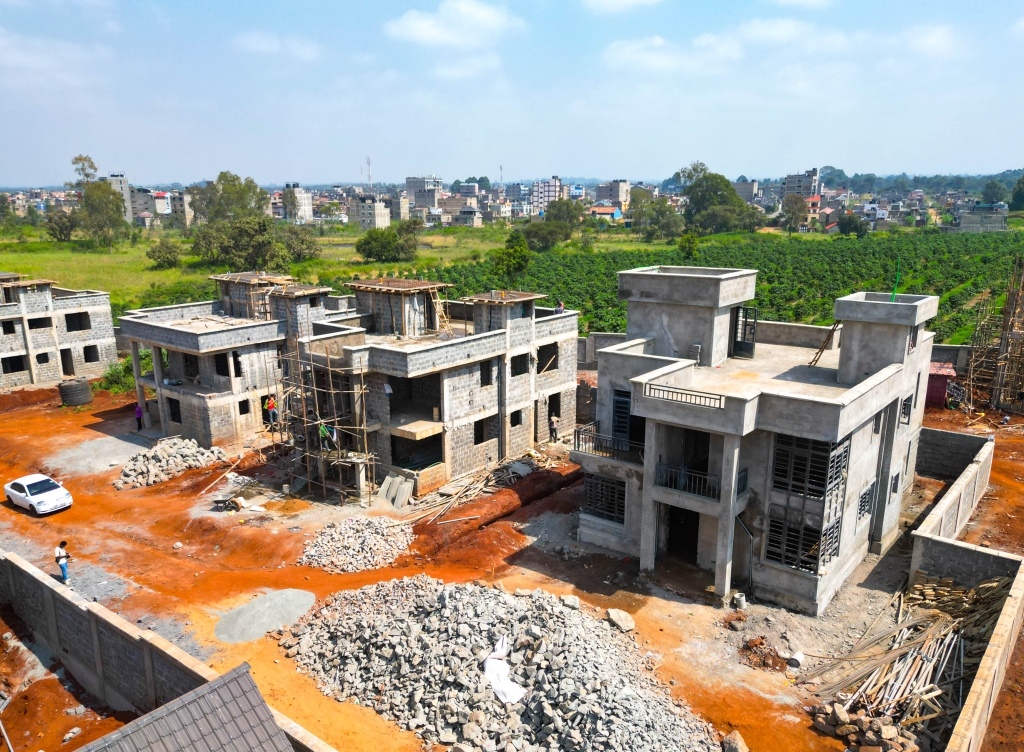
- Ribbon Development along Bypasses: Because the proposed bypasses were delayed by over 30 years (finally constructed in the 2010s under the Kibaki administration), land speculation ran rampant. When the roads were finally built, they triggered chaotic, unserviced private subdivisions along transport lines (Syokimau, Ruai, Kitengela) rather than coordinated satellite cities.
4. Modern Master Planning: NIUPLAN (2014–2030) and Metro 2030
To rectify decades of laissez-faire urban expansion, the Nairobi City County Government—in partnership with the Japan International Cooperation Agency (JICA)—developed the Nairobi Integrated Urban Development Master Plan (NIUPLAN 2014–2030).
Core Frameworks
- Sub-Center Creation: Transitioning Nairobi from a mono-centric city to a multi-nodal city by developing primary sub-centers (Westlands, Upper Hill, Kasarani, Karen, Ruaraka, and Airport City).
- Mass Rapid Transit System (MRTS): Integrating Commuter Rail, Bus Rapid Transit (BRT), and expressway networks.
- Land Use Rationalization: Updating spatial density zones to match actual development realities.
Real Estate Impact in the Current Market
- Rise of Commercial Sub-Centers: NIUPLAN formalized a market trend that had already begun: corporate capital fleeing the congested CBD. Upper Hill and Westlands emerged as primary Grade-A office hubs, driving land values in these nodes to record highs.
- Transit-Oriented Development (TOD): Land along major infrastructure corridors—such as the Nairobi Expressway, Thika Superhighway, and the Southern Bypass—experienced rapid capital growth, fueling high-density residential and mixed-use projects.
- Infrastructure vs. Urban Density Mismatch: While NIUPLAN provided a spatial blueprint, infrastructure funding gaps mean municipal sewer, water, and drainage upgrades lag behind private real estate development. High-density residential zones (e.g., Eastleigh, Kilimani, Roysambu) frequently experience utility deficits as a result.
Read Also: THE 7-MINUTE SHOW HOUSE RULE: How Your Brain Chooses a Home Before You Check the Price
Summary: How Master Plans Shaped Today’s Real Estate Dynamics

| Era & Plan | Intended Spatial Goal | Implementation Reality | Present-Day Real Estate Impact |
|---|---|---|---|
| 1927 / 1948 Colonial Plans | Racial segregation, low-density highlands, centralized CBD. | Enforced for Europeans; failed to plan for African urbanization. | Established the high-value “Green Line” in Western Nairobi and informal settlement pockets in lowlands. |
| 1973 NMGS | Metropolitan bypasses, satellite cities, multi-nodal growth. | Abandoned due to political shift and lack of institutional capacity. | Caused 30 years of unguided growth, informal infill, and unserviced suburban sprawl. |
| 2014 NIUPLAN (2014–2030) | Multi-nodal structure, Transit-Oriented Development, BRT networks. | Partially implemented (highways built; BRT & sewer networks lagging). | Driven commercial decentralization to Upper Hill/Westlands and fueled high-density apartment growth. |
Strategic Real Estate Takeaway
The historical enforcement gap between official planning and private development created two distinct asset classes in Nairobi:
- Unserviced High-Density Infill: Assets built in zones where private developers outpaced municipal infrastructure (high yield, but subject to operational risks, utility costs, and structural congestion).
- Master-Planned Private Ecosystems: To escape municipal infrastructure gaps, institutional capital increasingly favors private, master-planned developments (e.g., Tatu City, Two Rivers, Tilisi) that execute bulk utilities internally rather than relying on delayed city plans.